This guide provides basic instructions for creating dashboards in EdgeGO’s integrated Grafana instance.
Prerequisites
Before creating dashboards, ensure:
- Grafana is enabled: Navigate to Server Settings and enable the Grafana at Grafana[Beta] Settings
- Data is uploaded: Your custom data has been successfully uploaded to EdgeGO, if not, please refer to Upload Data
Accessing Grafana
Step 1: Access Grafana Interface
- Click the Grafana button on the EdgeGO menu bar
- Log in to Grafana with your EdgeGO account.
Step 2: Create New Dashboard
- Click Create Dashboard and then click Add Visualization, and select InfluxDB
- This action will take you to the Edit Panel page
Step 3: Query Configuration
- Use the following script to query data
- You can adjust the time range that you want to query
Query Script Template:
from(bucket: "<DeviceName>")
  |> range(start: -23h)
  |> filter(fn: (r) => r["_measurement"] == <measurement_name>)
Example Query Script:
from(bucket: "MXE-1300-1")
  |> range(start: -23h)
  |> filter(fn: (r) => r["_measurement"] == "test")
Step 4:
Click Apply at the top right corner to save the query script
The dashboard will be saved and you will be redirected to the dashboard page.
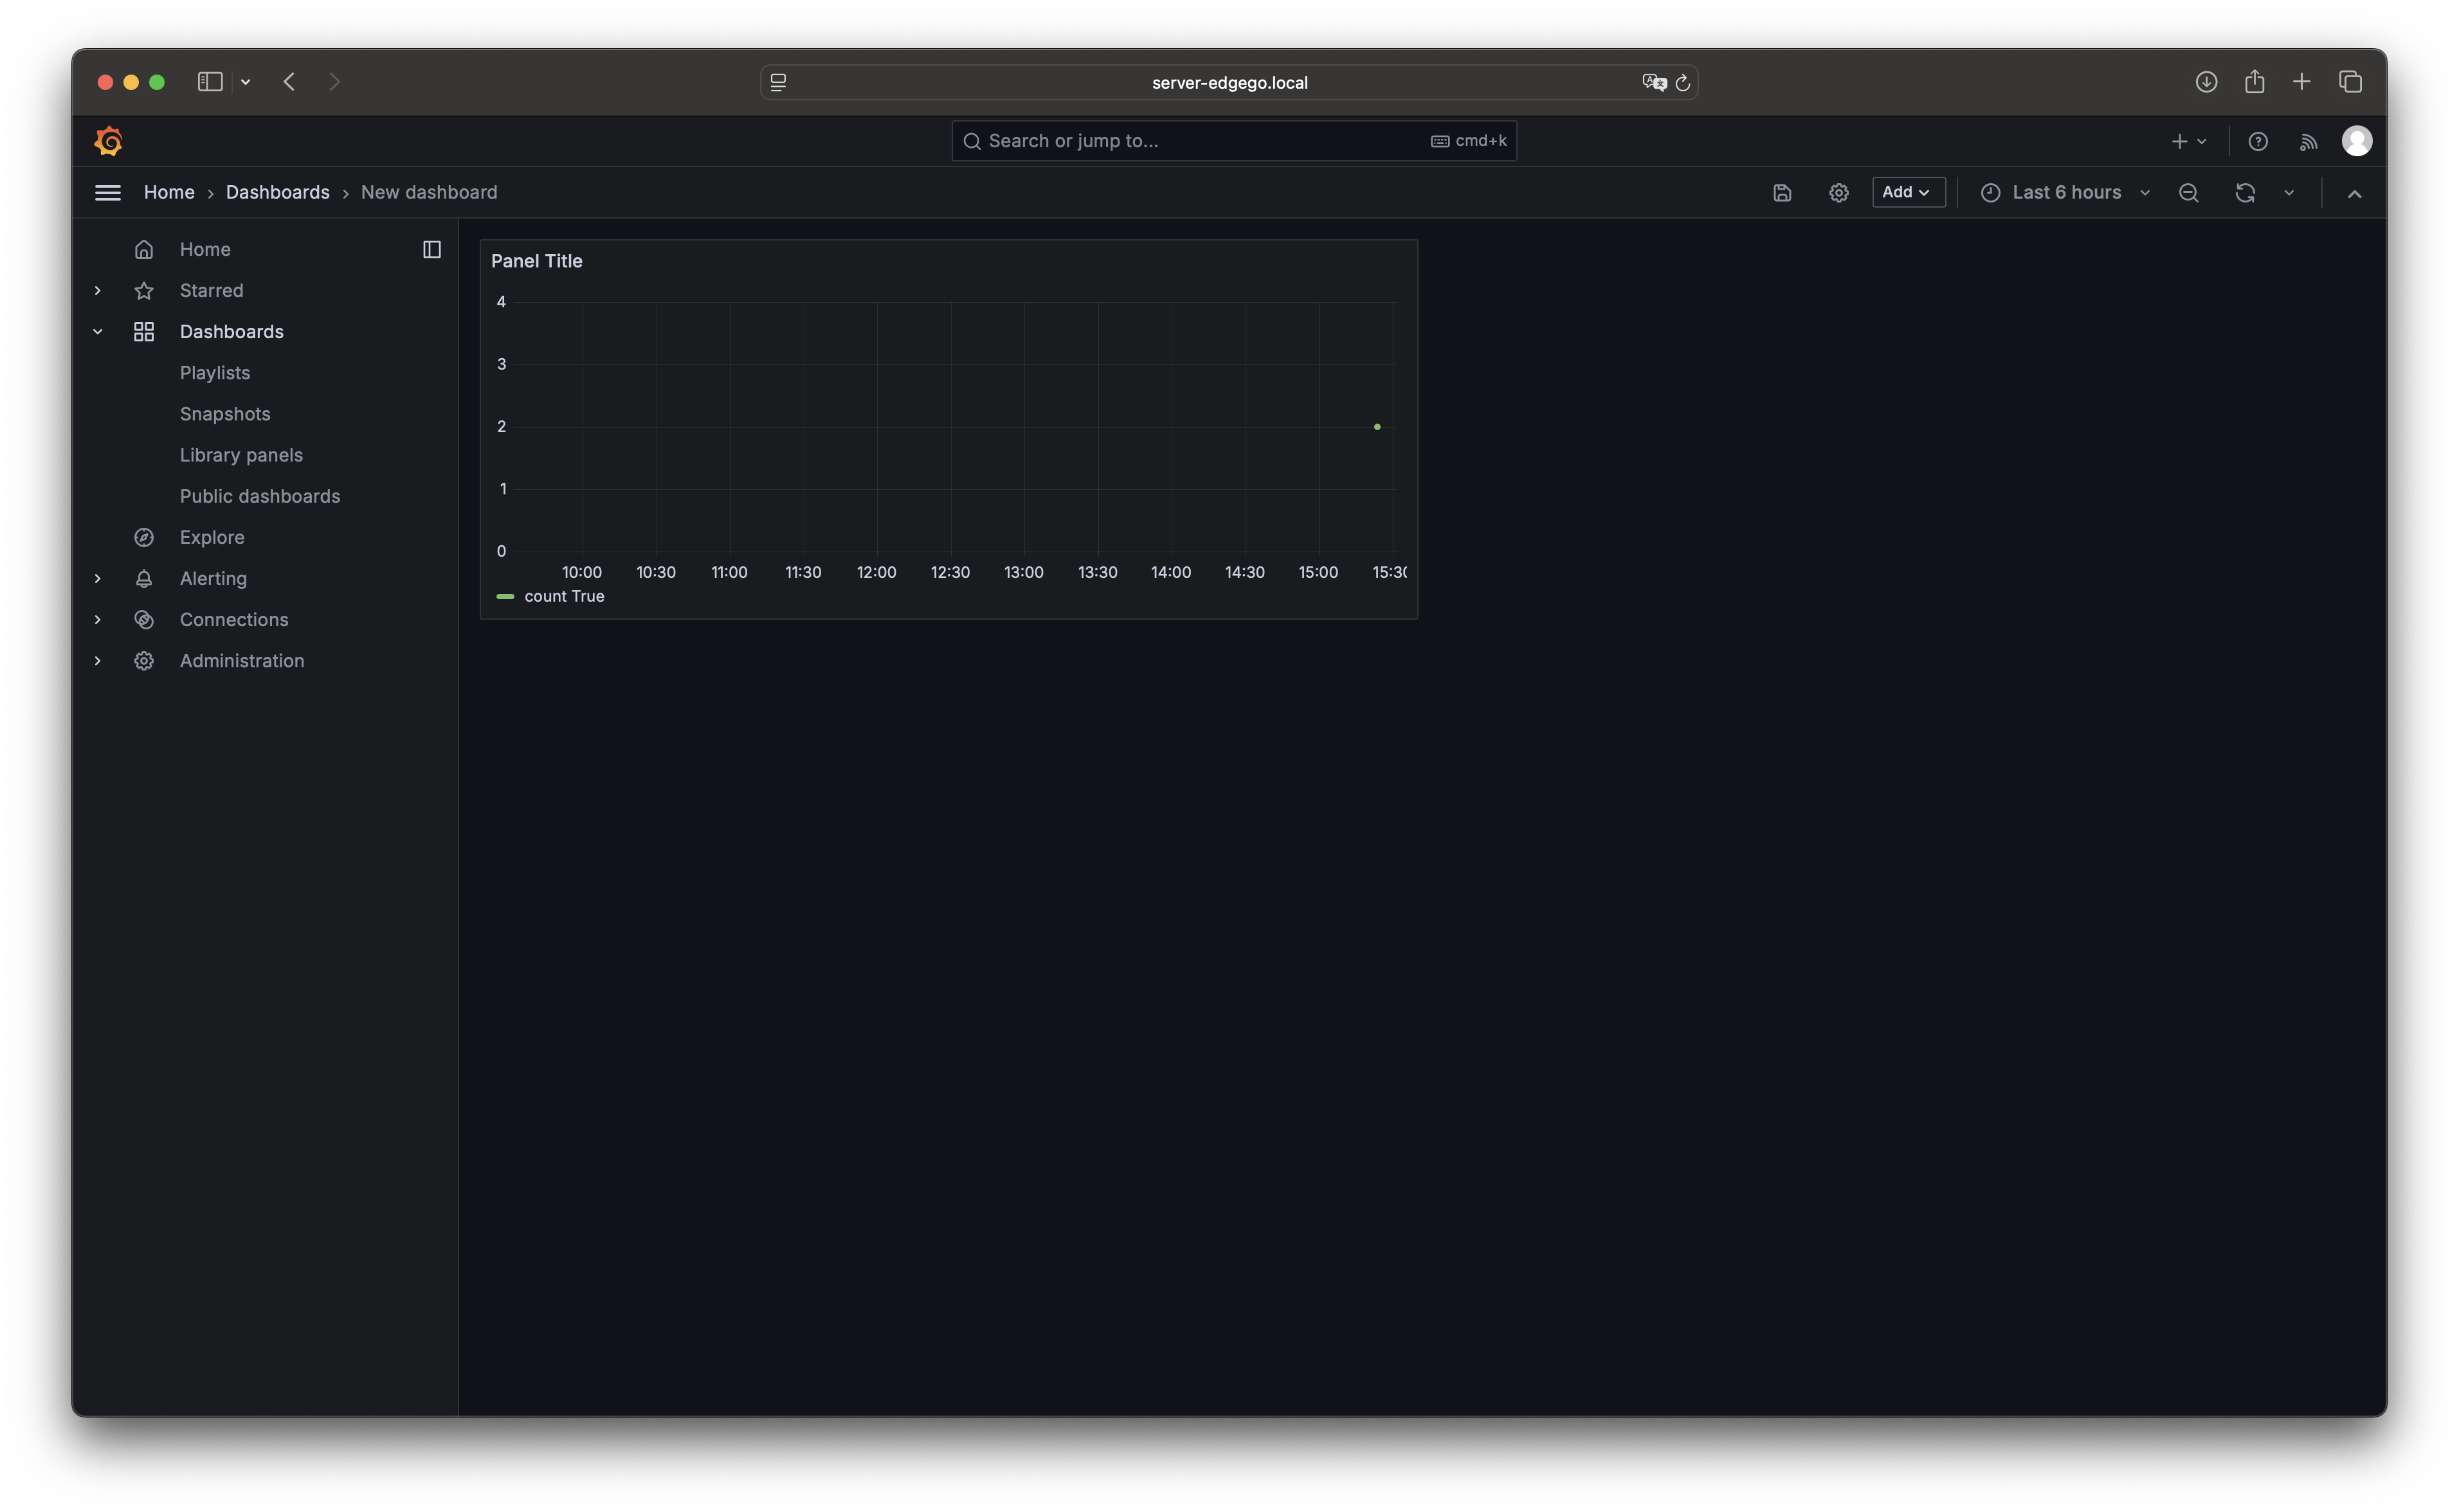
Step 5:
You can click Save dashboard at the top right corner to save the dashboard.